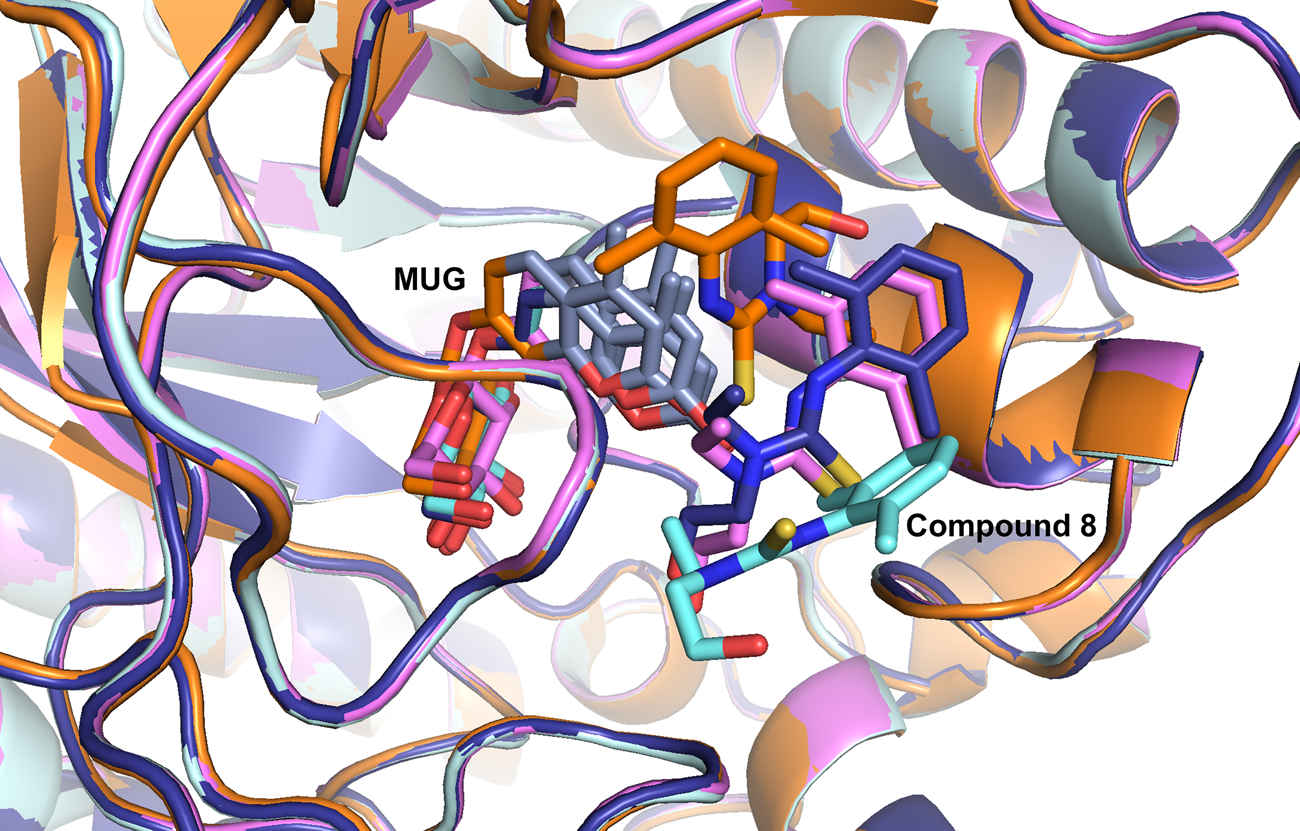
Protein-ligand interactions
NMR can be a powerful tool for studying protein ligand interactions, whether you are doing high-throughput screens of a compound library, or investigating a small number of interactions in detail. There are two main approaches: you can observe the ligand and look for properties that change upon protein binding; alternatively, you can observe the protein signal, and see how it is perturbed by the ligand. The first approach tends to work better for large proteins and weaker interactions, while the second is better for smaller proteins.
Ligand-observe experiments
There are three main ligand-observe experiments for detecting interactions with proteins: Saturation-transfer difference (STD), WaterLOGSY, and CPMG. All rely on the fact that NMR properties of large molecules are very different to those of small molecules. When the ligand binds to a protein, its NMR behaviour changes in a way that can be detected. The three experiments have slightly different mechanisms and are quick to run, so a high throughput screen would typically include all three: if a compound shows signal in multiple experiments, you would have a higher confidence that the interaction is real. Variations of the STD experiment can also be used to find the part of the ligand that interacts with the protein, and estimate the dissociation constant.
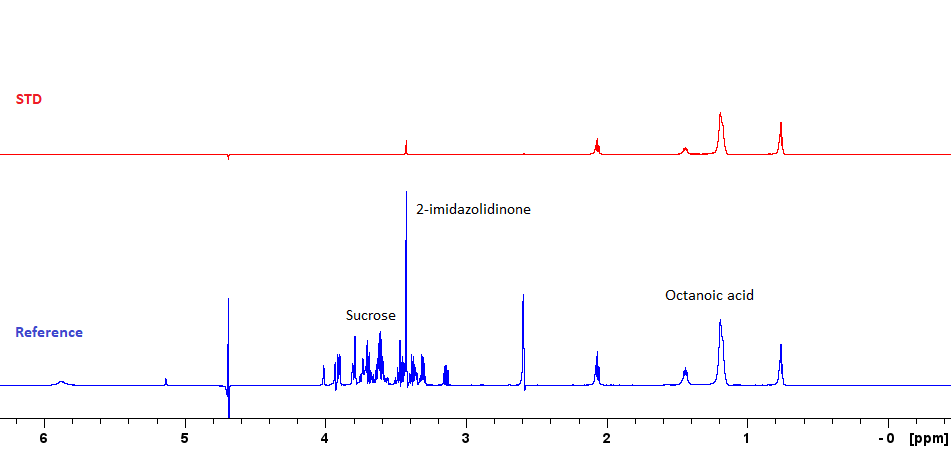
Ligand-observe experiments only require a relatively small amount of unlabelled protein (around 2-10 uM), which allows these methods to be applied even in cases where protein cannot be expressed in large quantities, or where isotopic labelling is infeasible.The (potential) ligands are used at higher concentrations (20-200x the protein concentration), so individual experiments are fairly short (~ 45 minutes for all three). The time taken to screen an entire library can be further reduced by mixing multiple ligands in the same NMR tube - the high resolution of NMR allows them to be distinguished. With 8 ligands per cocktail, you can potentially screen 256 compounds a day.
As these experiments rely on properties that differ with complex size, smaller proteins tend to work less well (because the size difference between the bound and unbound ligand is less pronounced). Ligand-observe experiments also work best when there is a relatively fast exchange between bound and unbound states (eg. koff > 1 s-1). Counterintuitively, very strongly binding ligands may produce a much weaker signal, meaning these experiments work well for fragment screening approaches, and less well for optimised ligands.
Protein-observe experiments
Protein-observe experiments mostly use the 15N-HSQC: you record spectra with and without the potential ligand, and look for changes in peak position and intensity. The advantages of this approach are that it works well for a wide range of interaction strengths (kD should be mM or less), and it can identify the binding site (if protein assignments are known). The disadvantages are that it requires labelled protein at higher concentrations, works less well for larger proteins, and the data is more time consuming to analyse.
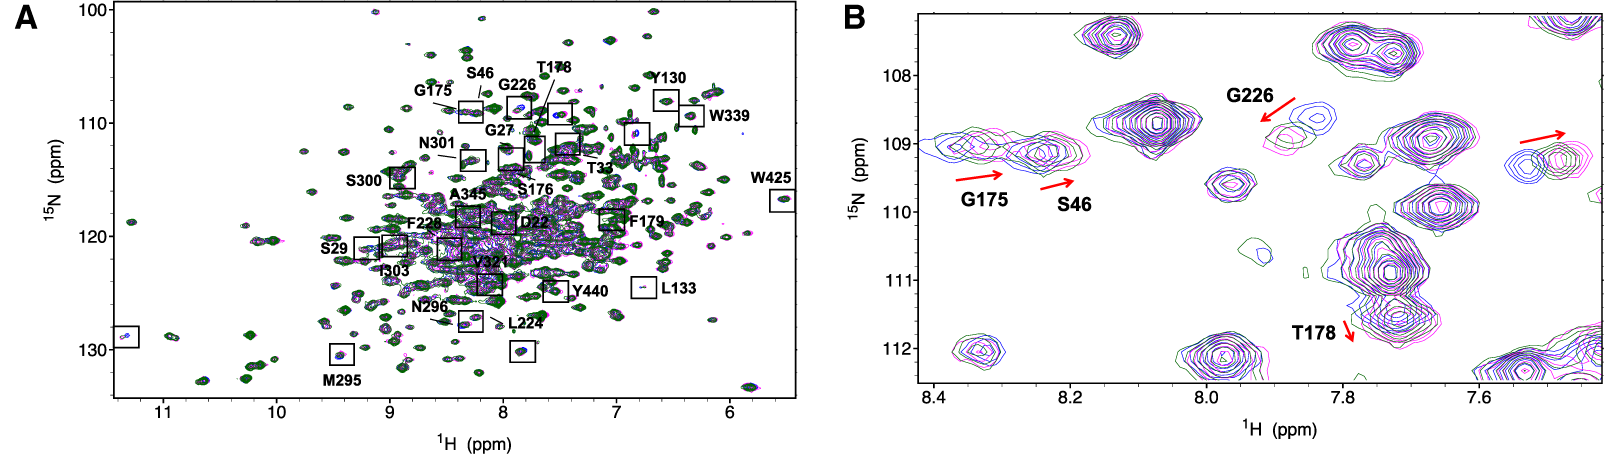
Protein-observe approaches are probably more effective for investigating a small number of known or suspected ligands in detail, rather than screening large libraries. Once peaks that change on ligand-binding have been identified, it is often possible to fit dissociation constants simply by titrating the ligand. With backbone assignments, it is possible to identify the ligand binding site, and model the ligand binding orientation with software such as HADDOCK .