15N-HSQC
Although 1D proton NMR contains peaks for every hydrogen in the protein, their use is limited by the large amount of overlap between signals. The HSQC experiment is a way of reducing the overlap by spreading the signals into a second dimension, allowing much more information to be extracted. We most commonly use a 15N-HSQC to get more information about the amide groups, but you can also look at aromatic or aliphatic groups using a 13C-HSQC.
Requirements
The 15N-HSQC only detects amide groups which contain the 15N isotope of nitrogen. The natural abundance of 15N is only ~0.5%, so you need quite high concentrations (greater than 500uM) and long experiment times for this to work on unlabelled proteins. In most cases, it's more practical to study 100% 15N-enriched protein, which can be produced easily and relatively cheaply using expression in minimal media. This reduces the concentration needed to around 20 uM, although higher concentrations are still recommended.
The standard 15N-HSQC experiment only gives good results for proteins (or protein complexes) up to ~20-25 kDa. For proteins above that size, we use a modified version called a 15N-TROSY.
How to interpret the data
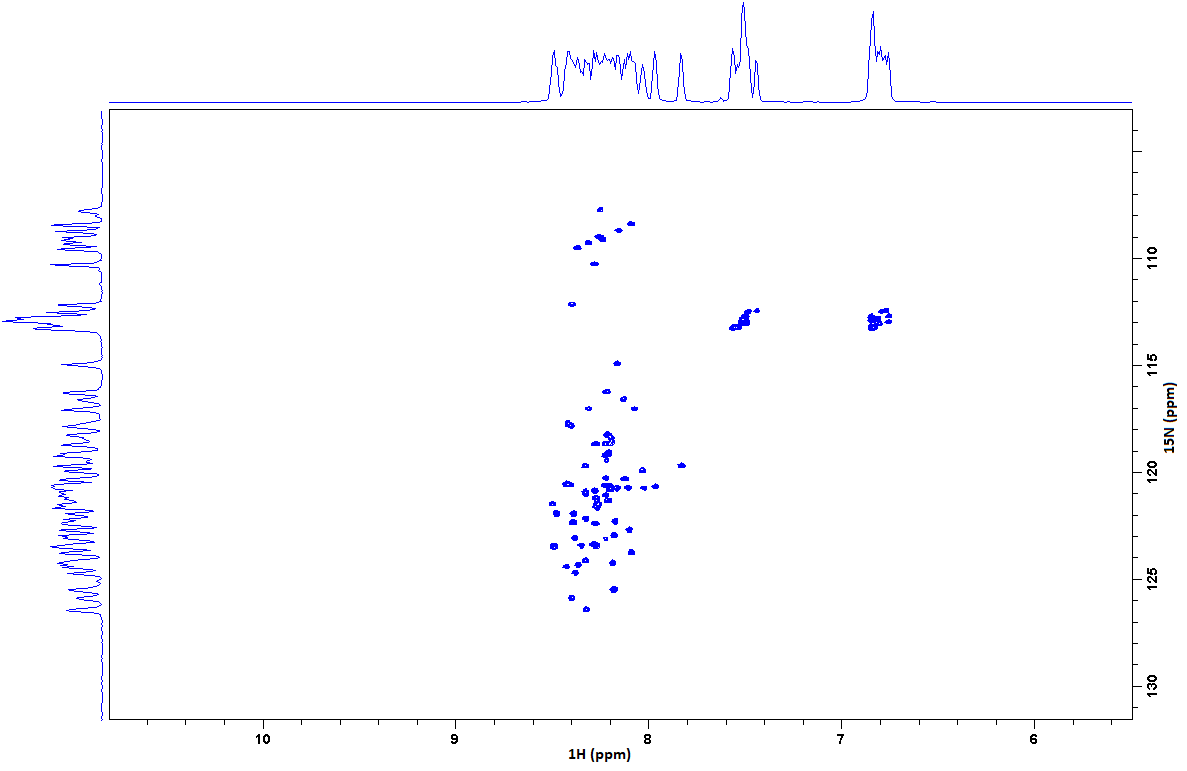
A typical 15N-HSQC spectrum of a small folded protein is shown below. Each peak on the spectrum originates from a single amide group: most will be from the protein backbone, but others will be from sidechains. Certain residues appear in characteristic positions, but others are fairly random. As in the 1D proton experiment, a tight distribution of peaks around 8-8.5 ppm (in the proton dimension) is typical of disordered proteins, while folded proteins give a distribution between 6 and 10 ppm
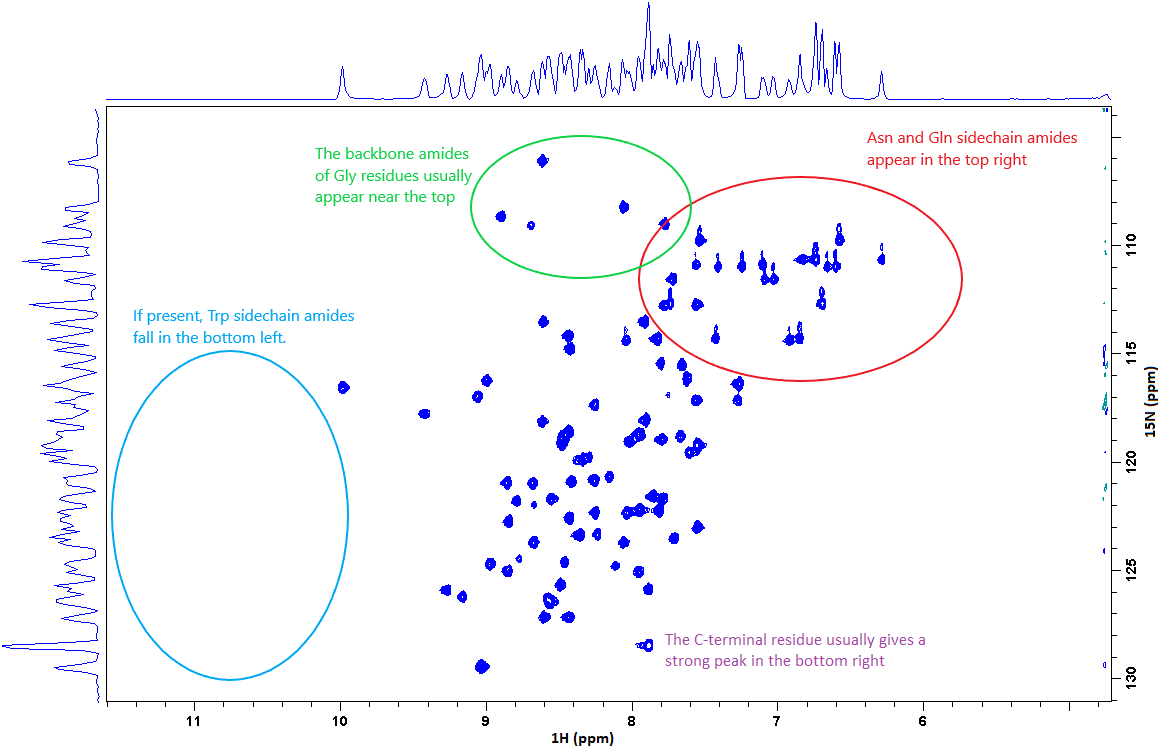
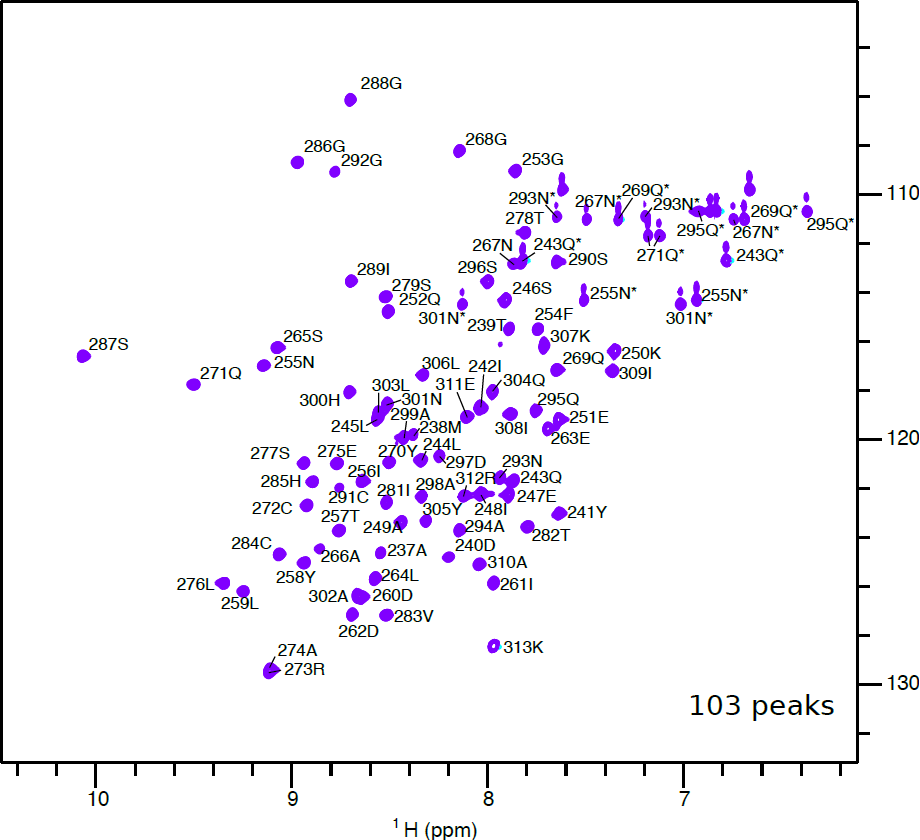
It is possible to assign each peak to a specific residue in the protein sequence, as in the spectrum below. This does require specialised experiments and samples, and is not feasible for all proteins, especially larger ones - more details are available here. However, you can gain useful information simply by counting how many peaks appear, and comparing it to the expected number predicted from the protein sequence. The expected number of peaks can be calculated as N_expected_peaks = N_residues - N_Pro + N_Trp + N_Arg + 2*(N_Asn + N_Gln) - 1.
If you see significantly more peaks than expected, you may have a mixture of states: this could be due to partial degradation, partial folding, or multiple conformations of the protein. If you see fewer peaks, this may be due to misfolding, aggregation, or "intermediate timescale" protein dynamics, which occur on a timescale of 10-4 to 10-3 s.
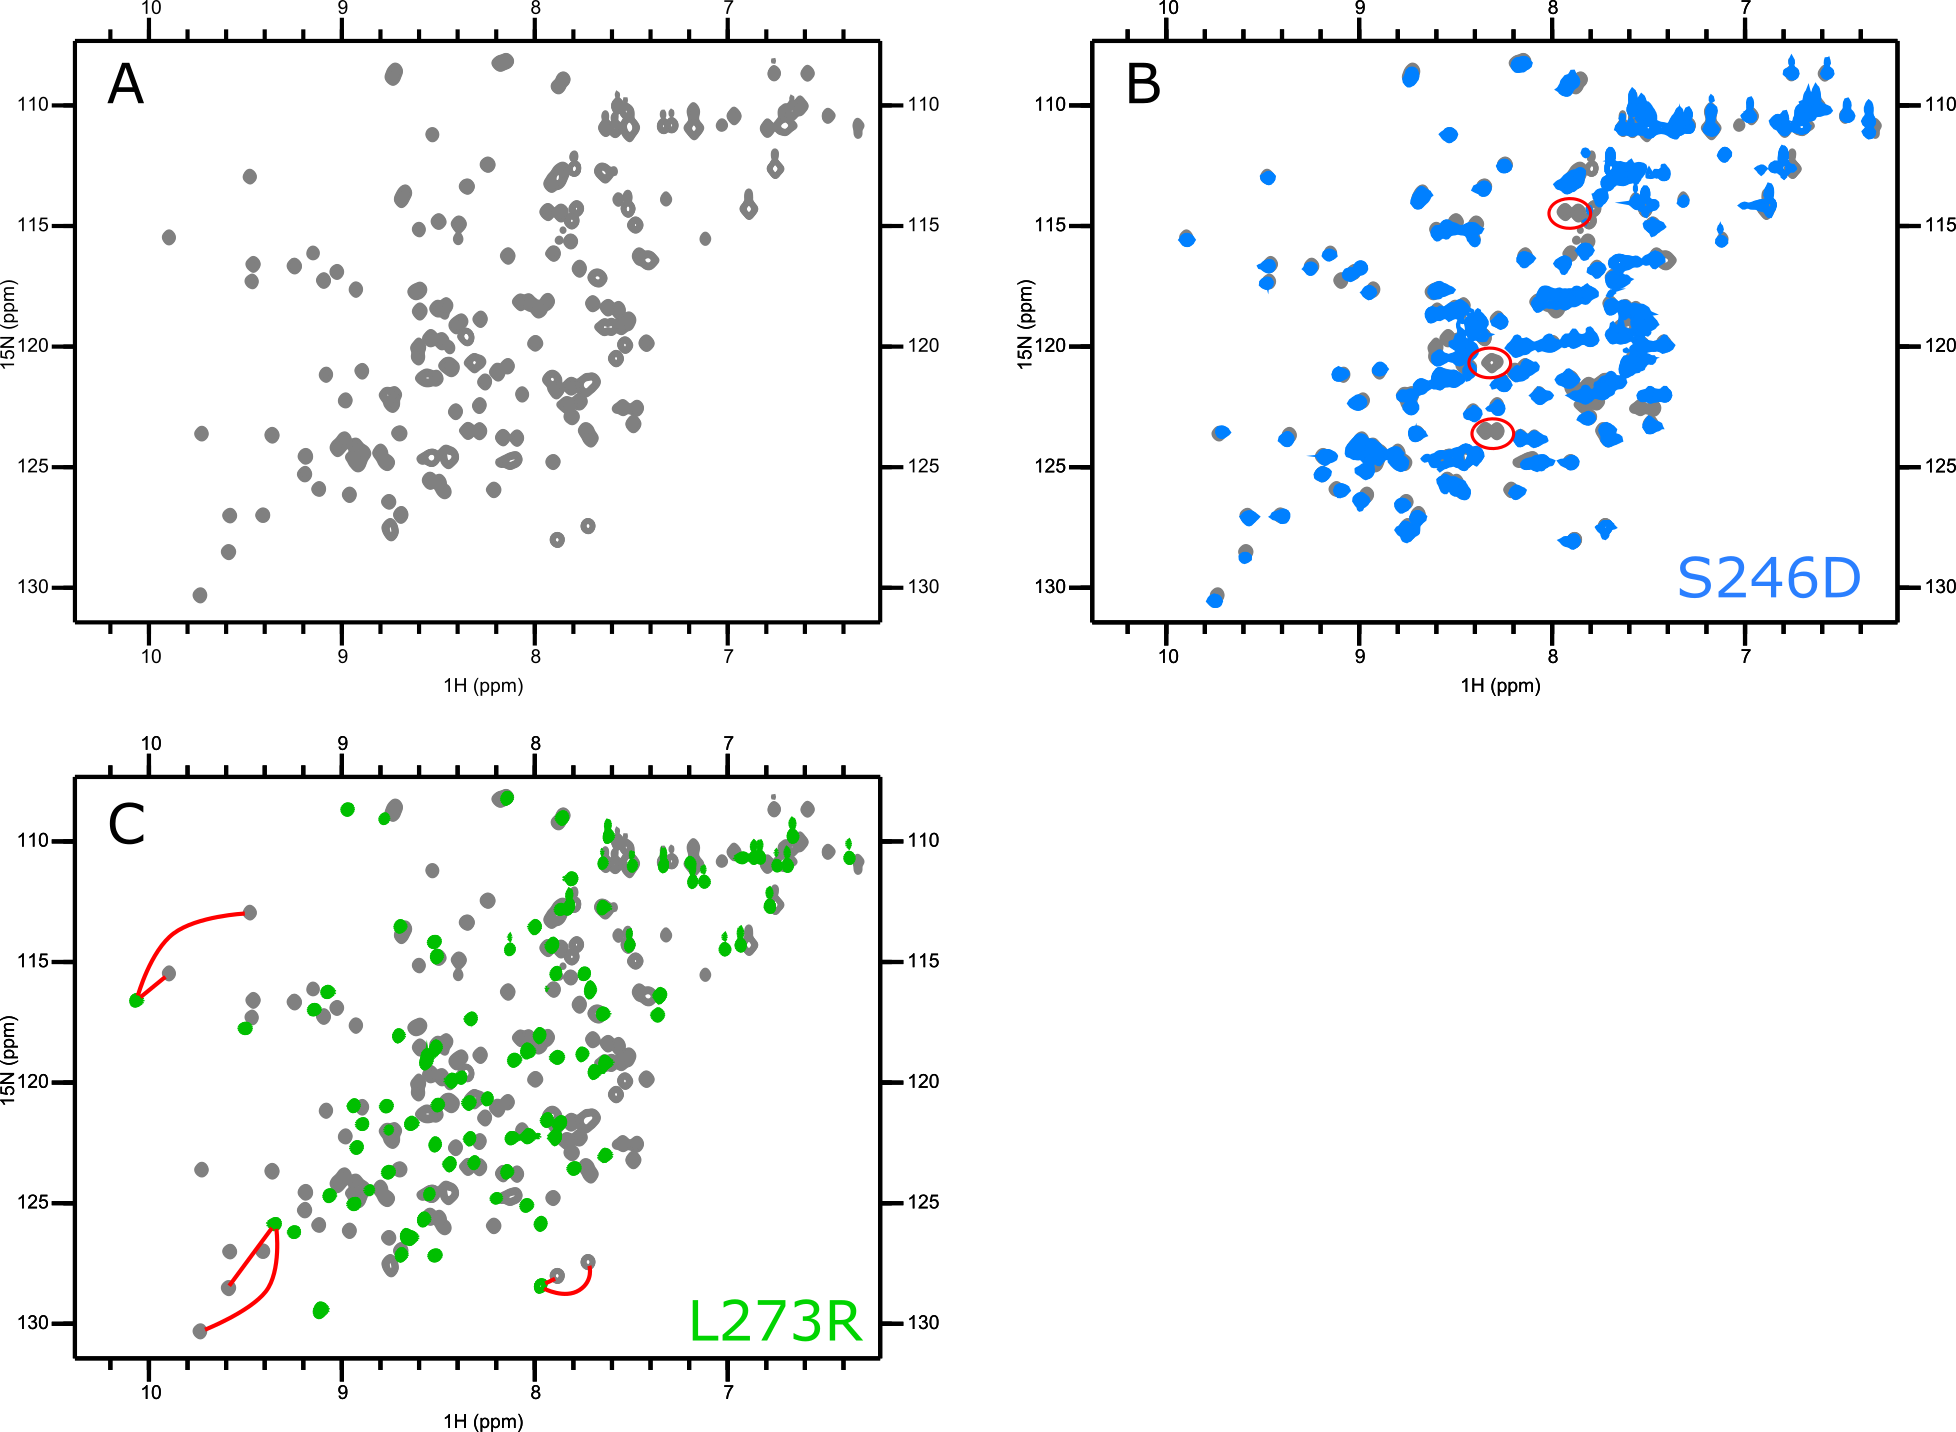
Applications of 15N-HSQCs
Even without assignments, you can still use the HSQC to monitor changes in the protein with different conditions. Recording HSQCs with different buffers and at different timepoints can identify conditions under which the protein is most stable. You can test point mutations to see whether they produce local or global changes in structure. Unlabelled small molecule or protein binding partners can be titrated in, allowing the fitting of dissociation constants. If assignments are available, binding interfaces can be identified.